
Knowledge Graphs and Volatility

Introduction
The goal of this post is to show how knowledge graphs can be used to shorten threat detection times.
How can knowledge graphs be applied to reduce threat detection times?
A knowledge graph can be a powerful tool in shortening threat detection time by facilitating more efficient analysis and decision-making processes. Here’s how it can be used:
- Data Integration: A knowledge graph can integrate diverse data sources relevant to cybersecurity, including network logs, system logs, threat intelligence feeds, user activity logs, and more. By consolidating this data into a unified structure, analysts can quickly access and analyze information pertinent to threat detection.
- Relationship Mapping: Knowledge graphs represent data as interconnected nodes and edges, allowing analysts to visualize relationships between various entities such as IP addresses, domains, users, and software. By mapping these relationships, analysts can identify potential attack paths, understand the context of security events, and uncover hidden connections indicative of malicious activity.
- Contextual Analysis: Knowledge graphs provide context by aggregating information from different sources and correlating events across time and space. Analysts can use this contextual information to differentiate between legitimate and suspicious activities, prioritize alerts based on severity and relevance, and make more informed decisions when investigating security incidents.
- Automated Reasoning: Knowledge graphs support automated reasoning techniques such as inference and deduction, enabling the identification of patterns, anomalies, and trends indicative of cyber threats. By applying machine learning algorithms and expert rules to the knowledge graph, organizations can automate certain aspects of threat detection, such as identifying known attack signatures or detecting deviations from normal behavior.
- Threat Intelligence Integration: Knowledge graphs can incorporate external threat intelligence feeds, including indicators of compromise (IOCs), threat actor profiles, and tactics, techniques, and procedures (TTPs). By correlating internal security events with external threat intelligence, analysts can quickly identify emerging threats, prioritize response efforts, and proactively defend against known attack vectors.
- Collaborative Analysis: Knowledge graphs facilitate collaborative analysis by providing a shared platform for security teams to collaborate, share insights, and collectively respond to security incidents. Analysts can annotate nodes with comments, attach relevant documents or evidence, and track the status of investigations, enabling seamless information sharing and collaboration across distributed teams.
By leveraging a knowledge graph in these ways, organizations can streamline their threat detection processes, reduce the time to detect and respond to security incidents, and enhance their overall cybersecurity posture.
What is a knowledge graph?
A knowledge graph is a structured representation of knowledge in a specific domain, organized as a graph of interconnected entities and their relationships. In a knowledge graph:
- Entities: These are the objects or concepts within the domain of interest. They can be anything from people, places, and organizations to abstract concepts like events, products, or ideas.
- Relationships: These define how entities are connected or related to each other. Relationships describe the associations, interactions, dependencies, or properties between entities. Relationships can have attributes that further describe the nature of the connection.
- Attributes: These provide additional information or properties associated with entities or relationships. Attributes can include metadata, descriptive properties, or quantitative data.
Knowledge graphs are typically represented as graphs, where nodes represent entities, edges represent relationships, and attributes are associated with nodes and edges. This graph-based structure enables rich, interconnected representations of knowledge that can be queried, analyzed, and reasoned over.
Knowledge graphs can be created manually by domain experts, automatically extracted from structured or unstructured data sources using natural language processing and machine learning techniques, or a combination of both. They are used in various applications such as search engines, recommendation systems, question answering systems, data integration, and knowledge management. In cybersecurity, knowledge graphs can be employed to model relationships between security-related entities such as threats, vulnerabilities, assets, and security controls, enabling more effective threat detection, incident response, and decision-making.
How can Neo4j be applied to develop knowledge graphs?
Neo4j is a popular graph database management system that is well-suited for implementing knowledge graphs due to its native graph storage and querying capabilities. Here are several ways Neo4j can be leveraged to implement knowledge graphs effectively:
- Data Modeling: Neo4j allows you to model your knowledge graph using nodes to represent entities, relationships to represent connections between entities, and properties to represent attributes of nodes and relationships. You can define node labels and relationship types to organize and categorize different types of entities and relationships within your domain.
- Cypher Query Language: Neo4j’s query language, Cypher, provides a powerful and expressive way to query and manipulate your knowledge graph. With Cypher, you can perform complex graph traversals, pattern matching, filtering, and aggregation operations to extract insights and answer questions about your data.
- Graph Algorithms: Neo4j includes a library of graph algorithms that can be used to analyze and extract useful information from your knowledge graph. These algorithms include centrality measures, community detection, path finding, and similarity metrics, which can help identify important nodes, clusters, and patterns within your data.
- Integration with Other Systems: Neo4j provides various integration options, including APIs, drivers, and plugins, that allow you to easily connect your knowledge graph with other systems and tools in your ecosystem. You can import data from external sources, export query results, and integrate with analytics, visualization, and machine learning platforms to extend the capabilities of your knowledge graph.
- Scalability and Performance: Neo4j is designed for scalability and high-performance graph processing, allowing you to store and analyze large-scale knowledge graphs with millions or even billions of nodes and relationships. You can deploy Neo4j in distributed environments, leverage caching and indexing mechanisms, and optimize query execution to ensure fast and efficient performance.
- Graph Visualization: Neo4j provides built-in tools for visualizing and exploring your knowledge graph, allowing you to interactively navigate and visualize the structure and connections of your data. You can customize visualizations, apply layout algorithms, and create interactive dashboards to gain insights and communicate findings effectively.
By leveraging Neo4j’s capabilities, you can implement knowledge graphs that enable you to model, store, query, analyze, and visualize complex relationships and dependencies within your domain, empowering you to make informed decisions and derive actionable insights from your data.
What is the Volatility Framework?
The “volatility framework” typically refers to a powerful open-source memory forensics framework called “Volatility.” It’s widely used by digital forensic analysts and incident responders to extract and analyze volatile memory (RAM) data from live systems, hibernation files, and crash dumps. Volatility enables investigators to uncover critical information such as running processes, network connections, open files, registry keys, and user activities, which can help in understanding the behavior of malware, identifying security breaches, and reconstructing the timeline of events during a security incident.
Key features of the Volatility framework include:
- Cross-Platform Support: Volatility supports memory forensics on various operating systems, including Windows, Linux, macOS, and Android. It can analyze memory images obtained from physical machines, virtual machines, and cloud instances.
- Extensive Plugin Architecture: Volatility has a modular architecture with a vast library of plugins for performing specific memory analysis tasks. These plugins can extract information about processes, network connections, drivers, filesystems, registry entries, and more.
- Memory Analysis Techniques: Volatility employs advanced memory analysis techniques to interpret memory structures, data structures, and kernel data structures from memory dumps. It can reconstruct process execution paths, identify malware artifacts, and extract volatile artifacts such as passwords and encryption keys.
- Timeline Analysis: Volatility supports timeline analysis by correlating memory artifacts with other forensic evidence, such as filesystem metadata, event logs, and network traffic. This helps investigators reconstruct the sequence of events and identify suspicious activities that occurred on the system.
- Community Support and Development: Volatility is an open-source project with an active community of developers and contributors. New plugins, features, and improvements are continuously developed and shared with the community, making Volatility a versatile and constantly evolving tool for memory forensics.
- Integration with Other Tools: Volatility can be integrated with other forensic tools and platforms to enhance its capabilities and streamline the investigation process. It provides APIs and interfaces for scripting, automation, and integration with popular forensic frameworks and incident response platforms.
Overall, the Volatility framework is a valuable resource for digital forensic analysts and incident responders, providing them with the tools and techniques needed to extract and analyze volatile memory data for investigating security incidents, identifying malware infections, and understanding system behavior.
By analyzing real time memory streams how can the Volatility framework be used to shorten the time to detect threats?
Using the Volatility framework to analyze real-time memory streams can significantly shorten the time to detect threats by providing immediate visibility into running processes, network connections, and other volatile artifacts indicative of malicious activity. Here’s how Volatility can be leveraged for real-time threat detection:
- Continuous Monitoring: Volatility can be configured to monitor memory streams in real-time, either directly from live systems or from memory acquisition tools such as LiME (Linux Memory Extractor) or WinPmem. By continuously monitoring memory, Volatility can detect and alert on suspicious processes, network connections, and other volatile artifacts as they occur.
- Process Analysis: Volatility can identify and analyze running processes in memory, including hidden and malicious processes that may be part of an ongoing attack. By monitoring process creation, termination, and injection events in real-time, Volatility can quickly flag anomalous behavior such as process spawning by malware or unauthorized applications.
- Network Analysis: Volatility can extract information about active network connections, listening ports, and network protocols from memory. By monitoring network activity in real-time, Volatility can detect unauthorized communication channels, suspicious command-and-control (C2) traffic, and data exfiltration attempts by malware or intruders.
- Malware Detection: Volatility includes plugins for identifying and analyzing known malware signatures, behaviors, and indicators of compromise (IOCs) in memory. By comparing memory artifacts against a database of known malware characteristics, Volatility can quickly identify and alert on the presence of malicious code or malware-infected processes in real-time.
- Anomaly Detection: Volatility can perform anomaly detection by comparing current memory snapshots with baseline profiles of normal system behavior. By monitoring deviations from baseline behavior in real-time, Volatility can detect unusual patterns, unauthorized changes, and suspicious activities that may indicate a security breach or compromise.
- Threat Hunting: Volatility supports proactive threat hunting by enabling security analysts to search for specific memory artifacts, indicators, or attack patterns associated with known threats or emerging attack techniques. By conducting targeted searches and queries in real-time, Volatility can uncover hidden threats and security weaknesses before they escalate into full-blown incidents.
- Automated Response: Volatility can be integrated with security orchestration, automation, and response (SOAR) platforms to automate incident response actions based on real-time memory analysis findings. This allows organizations to respond rapidly to security threats, isolate compromised systems, and mitigate the impact of security incidents in real-time.
By leveraging Volatility for real-time memory analysis, organizations can proactively detect and respond to security threats more effectively, minimizing the dwell time of attackers and reducing the potential impact of security breaches on their systems and data.

Integrating Volatility and Neo4j
Had a requirement to interface json output from Volatility to Neo4j. The interface is written in python.
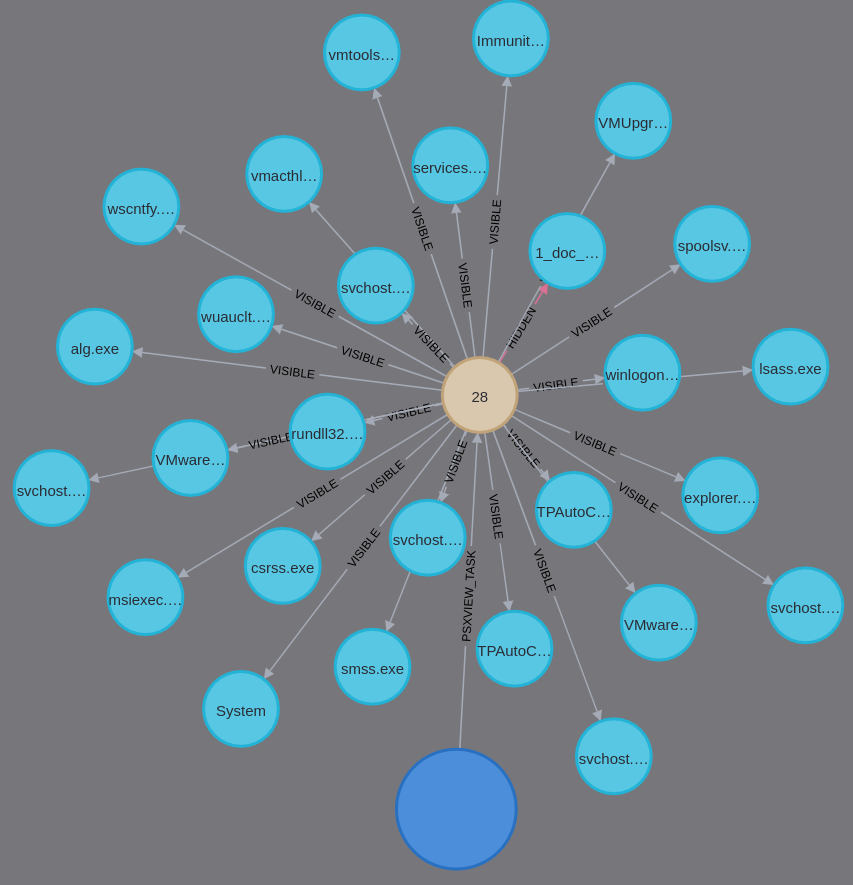
The following image shows using the interface. The interface is designed to run 1..N Volatility commands in parallel against a memory image, translate the json output files to Cypher, and send the queries to Neo4j – automatically.
The image shows the output of the Volatility psxview command detecting a hidden process on a Windows machine. The relationship HIDDEN identifies the hidden process and the node shows why the process was tagged as hidden. The start of 1..N knowledge graphs.
Discover more from Threat Detection
Subscribe to get the latest posts sent to your email.