

Why is it so difficult to detect cyber criminals hiding in computer memory?
Detecting criminals hiding in computer memory poses significant challenges for cybersecurity professionals. Unlike traditional storage, volatile memory (RAM) is dynamic, constantly changing, and often used by sophisticated attackers to hide their activities. This complexity makes memory forensics a critical, yet challenging aspect of digital investigations.
1. Volatility of Memory
- Dynamic Nature: RAM is constantly being read from and written to, with its contents changing rapidly. This dynamism makes it difficult to capture a precise and comprehensive snapshot of all activities.
- Data Persistence: Data in RAM is temporary and lost when the system is powered off, complicating the process of obtaining memory dumps for analysis.
2. Sophisticated Attack Techniques
- Advanced Malware: Modern malware often uses sophisticated techniques to evade detection, such as memory-resident malware that does not leave traces on the disk.
- Code Injection: Attackers inject malicious code into legitimate processes, making it hard to distinguish between normal and malicious activities within memory.
3. Encryption and Obfuscation
- Encrypted Payloads: Attackers encrypt their payloads to prevent detection by traditional scanning tools. Decrypting these payloads often requires significant computational resources and time.
- Obfuscation Techniques: Malware authors use various obfuscation techniques, such as packing and polymorphism, to change the appearance of the code and avoid signature-based detection.
4. Rootkits and Kernel-Level Attacks
- Rootkits: Rootkits operate at the kernel level, providing attackers with high privileges and the ability to hide their presence from both the operating system and security tools.
- System Call Hooks: By hooking system calls, attackers can intercept and modify system behavior, making it challenging to identify abnormal activities.
5. Lack of Signatures and Heuristics
- Unknown Threats: Signature-based detection relies on known patterns of malicious behavior. New, unknown threats can evade these detection methods.
- Behavioral Analysis: Behavioral heuristics require understanding normal system behavior to identify anomalies. This approach can be resource-intensive and may produce false positives.
6. Stealth Techniques
- Process Hollowing: Attackers create a new process in a suspended state, hollow out its memory, and replace it with malicious code, making the process appear legitimate.
- DLL Injection: Injecting malicious Dynamic Link Libraries (DLLs) into legitimate processes allows attackers to execute their code under the guise of a trusted application.
7. Complex Memory Structures
- Fragmentation: Memory fragmentation and allocation patterns can scatter malicious code across different memory regions, complicating the analysis.
- Sparse Documentation: The complexity of modern operating systems and the lack of detailed documentation on memory structures can hinder forensic analysis.
8. Evasion Techniques
- Anti-Forensic Tools: Attackers use anti-forensic tools designed to erase traces, manipulate timestamps, and otherwise obscure their activities within memory.
- Environment-Specific Behaviors: Malware may behave differently in analysis environments compared to real-world conditions, making detection in live memory challenging.
Why so difficult to detect?
The difficulty in detecting criminals hiding in computer memory stems from the dynamic nature of RAM, sophisticated attack techniques, and the use of advanced evasion strategies. Effective memory forensics requires a deep understanding of these challenges and the development of robust tools and techniques to uncover hidden threats. As attackers continue to evolve, so must the methods used to detect and counter their activities in computer memory.

How can volatility detect sophisticated attacks?
Volatility, an advanced memory forensics framework, is instrumental in uncovering sophisticated stealth attacks that hide in computer memory. This framework allows cybersecurity professionals to extract and analyze digital artifacts from volatile memory (RAM) dumps, providing crucial insights into malicious activities that evade traditional detection methods.
1. Memory Acquisition and Profiling
- Creating Memory Dumps: The first step involves creating a memory dump using tools like DumpIt or FTK Imager. Ensuring the integrity and authenticity of these dumps is critical.
- Profile Selection: Load the memory dump into Volatility with the correct profile matching the operating system and version. This step is crucial for accurate analysis.
2. Process and DLL Analysis
- Listing Processes: Commands like
pslist,pstree, andpsscanhelp list all running processes. Hidden or suspicious processes can be identified by comparing these outputs. - DLL Examination: Using
dlllistandldrmodules, Volatility can identify loaded DLLs within processes. Anomalies in DLL lists can indicate malicious code injections.
3. Detecting Code Injection
- Malfind Plugin: The
malfindcommand scans memory for signs of injected code, such as process hollowing or DLL injection, highlighting memory regions that have been modified. - VAD Analysis: Virtual Address Descriptors (VAD) analysis helps detect abnormal memory allocations. Commands like
vadinfocan reveal regions allocated by malicious processes.
4. Network Connection Analysis
- Network Scanning: Commands like
netscanandconnscanidentify active network connections and listening ports. Unusual connections can indicate data exfiltration or command-and-control channels. - Analyzing Sockets: The
sockscancommand lists active sockets, helping to detect unauthorized communication channels established by malware.
5. Registry and Configuration Analysis
- Registry Hives: Volatility can extract registry hives using commands like
hivelistandprintkey, revealing configurations and settings that indicate persistence mechanisms. - Auto-Start Entries: Using
autoruns, Volatility can list auto-start entries in the registry, helping identify how malware achieves persistence.
6. File System and Kernel Module Analysis
- File Scanning: Commands like
filescanidentify files mapped in memory, including those not visible on the disk, which may be used by malware. - Kernel Modules: Using
modulesandmodscan, Volatility lists loaded kernel modules, helping detect rootkits and unauthorized kernel-level modifications.
7. Timeline and Event Correlation
- Creating Timelines: The
timelinerplugin generates a timeline of system events, correlating process creation, file access, and network activity to uncover the sequence of an attack. - Event Correlation: By analyzing the timeline, investigators can identify patterns and correlations between different malicious activities, providing a comprehensive view of the attack.
8. Rootkit Detection
- System Call Hooks: Commands like
ssdtandgdtcheck for hooks in the system call table and global descriptor table, which are often manipulated by rootkits to hide their presence. - Hidden Modules: Detecting hidden kernel modules that do not appear in standard listings using advanced plugins helps uncover rootkits.
9. Advanced Heuristics and Anomaly Detection
- Behavioral Analysis: Using plugins like
apihooks, Volatility can detect API hooking, a technique used by malware to intercept system calls. - Memory Pattern Analysis: Analyzing memory patterns and heuristics can help identify unusual behaviors that signature-based detection might miss.
How are sophisticated attacks detected?
Volatility’s comprehensive suite of tools and plugins makes it an invaluable asset in detecting sophisticated stealth attacks. By analyzing processes, network connections, registry entries, and kernel modules, Volatility can uncover hidden malicious activities that evade traditional detection methods. Its ability to perform in-depth memory analysis and timeline correlation provides cybersecurity professionals with the insights needed to detect and mitigate advanced threats.

How does visualizing data generated by Volatility help detect threats?
1. The Role of Data Visualization
Explanation of Data Visualization Data visualization is the graphical representation of information and data. By using visual elements like charts, graphs, and maps, data visualization tools provide an accessible way to see and understand trends, outliers, and patterns in data.
Importance of Visual Representation of Data Visualizing data helps in:
- Simplifying complex data sets
- Highlighting significant data points
- Facilitating quick comprehension of trends
Common Visualization Tools and Techniques
- Bar charts
- Line graphs
- Pie charts
- Scatter plots
2. Benefits of Visualizing Volatility Data
Early Detection of Threats Visualizing volatility data enables the early detection of anomalies that could signify potential threats. For instance, a sudden spike in network traffic might indicate a cyber attack.
Enhanced Pattern Recognition Visual tools help in identifying patterns and trends that are not immediately apparent in raw data. This can be crucial in recognizing ongoing threats and understanding their progression.
Improved Decision-Making Visual representations allow for more informed decision-making by presenting data in a clear and concise manner, helping stakeholders understand the severity and nature of potential threats.
Better Communication of Complex Data Visual data can be easily shared and understood across different teams, facilitating better communication and collaborative efforts in threat detection and mitigation.
3. Techniques for Visualizing Volatility Data
Time Series Analysis
- Tracks changes over time, identifying trends and periodic fluctuations.
Heat Maps
- Uses color gradients to show data density and intensity, highlighting areas of concern.
Anomaly Detection Graphs
- Identifies data points that deviate significantly from the norm, signaling potential threats.
Network Graphs and Connections
- Visualizes relationships and interactions within a network, identifying unusual connections that may indicate security breaches.
4. Case Studies and Real-world Applications
Case Study: Financial Market Analysis In financial markets, visualizing volatility data helps in identifying trends and predicting market movements. This allows traders to make informed decisions and mitigate financial risks.
Case Study: Cybersecurity Threat Detection A cybersecurity firm utilized heat maps and anomaly detection graphs to monitor network traffic. By visualizing these data, they were able to identify and respond to a potential DDoS attack before it could cause significant damage.
Lessons Learned
- The importance of timely data visualization
- The need for continuous monitoring
- The role of advanced analytics in enhancing threat detection
5. Challenges and Limitations
Data Accuracy and Reliability Issues Ensuring the accuracy and reliability of data is crucial, as incorrect data can lead to false positives or missed threats.
Complexity of Data Visualization Tools Some tools require specialized knowledge and training, which can be a barrier for some organizations.
Interpretation Challenges Interpreting visual data correctly requires expertise, as misinterpretation can lead to incorrect conclusions and responses.
6. Future Trends in Data Visualization for Threat Detection
Advances in AI and Machine Learning AI and machine learning are set to revolutionize data visualization by automating the detection of patterns and anomalies, enhancing accuracy and efficiency.
Integration of Real-time Data Analytics Real-time analytics will enable organizations to visualize data as it is collected, allowing for immediate detection and response to threats.
Emerging Visualization Technologies New technologies such as augmented reality (AR) and virtual reality (VR) will provide more immersive and intuitive ways to interact with and interpret data.
9. Why is visualizing important?
Visualizing volatility data is a critical component in the early detection and mitigation of threats. By transforming complex data sets into understandable visual formats, organizations can enhance their threat detection capabilities, improve decision-making, and ensure better communication across teams. As technology continues to advance, the role of data visualization in threat detection will only become more significant, driving the need for continuous innovation and adaptation in this field.
How does Neo4j and knowledge graphs help visualize detected threats?
1. Detecting and Visualizing Threats
In the realm of cybersecurity, detecting and visualizing threats is crucial for proactive defense. Traditional methods often struggle to handle the complexity and volume of data involved. Neo4j, a graph database, combined with knowledge graphs, offers a powerful solution for visualizing and understanding detected threats, enabling more effective threat detection and response.
2. Understanding Neo4j and Knowledge Graphs
Definition and Overview of Neo4j Neo4j is a graph database management system designed to handle highly connected data. Unlike traditional relational databases, Neo4j uses graph structures with nodes, edges, and properties to represent and store data, making it exceptionally well-suited for analyzing relationships and patterns.
Explanation of Knowledge Graphs Knowledge graphs are a type of data model that integrates information from various sources into a graph structure, highlighting relationships between entities. They provide a holistic view of data, enabling more effective analysis and insight generation.
Use Cases of Knowledge Graphs in Cybersecurity
- Identifying relationships between various entities (e.g., users, devices, activities)
- Mapping out attack vectors and threat landscapes
- Analyzing historical data for patterns indicative of potential threats
3. Role of Neo4j in Threat Detection
Data Modeling Capabilities of Neo4j Neo4j’s flexible schema allows for the representation of complex and dynamic data structures, which is essential for modeling the intricate relationships found in cybersecurity data.
Real-time Data Processing Neo4j supports real-time data updates and querying, making it possible to detect and respond to threats as they emerge.
Scalability and Performance Neo4j can handle large volumes of data and complex queries efficiently, which is crucial for processing the vast amounts of information generated in cybersecurity operations.
4. Benefits of Using Knowledge Graphs for Visualizing Threats
Enhanced Pattern Recognition Knowledge graphs help in identifying patterns and anomalies in data that might indicate a threat. By visualizing connections and relationships, it becomes easier to spot irregularities.
Better Understanding of Complex Relationships Knowledge graphs can represent complex relationships between entities, providing a clearer picture of how different elements within a network are interconnected. This aids in understanding potential attack vectors and vulnerabilities.
Simplified Threat Detection Process By using graph visualizations, analysts can quickly comprehend complex data, streamline threat detection processes, and focus on critical areas that require immediate attention.
5. Techniques for Visualizing Threats with Neo4j and Knowledge Graphs
Graph Queries and Analytics Neo4j supports Cypher, a powerful query language that allows for the extraction and analysis of data from knowledge graphs. Queries can be used to identify suspicious patterns and relationships.
Visualization Tools and Techniques
- Neo4j Bloom: A visualization tool designed for graph data, enabling intuitive exploration and interaction with data.
- GraphXR: A platform for visualizing and analyzing large-scale graph data, useful for detecting complex threats.
- Gephi: An open-source network visualization tool that can be used to create visual representations of graph data.
Real-world Examples
- Visualizing network traffic to identify unusual patterns
- Mapping out connections between compromised accounts and affected systems
- Tracking the spread of malware through a network
6. Case Studies and Applications
Case Study: Detecting Insider Threats A financial institution used Neo4j to map out employee interactions and access patterns. By visualizing these relationships, they identified unusual access patterns indicative of potential insider threats.
Case Study: Network Intrusion Detection A cybersecurity firm utilized Neo4j to visualize network traffic data. By mapping connections and detecting anomalies, they were able to identify and respond to intrusion attempts more effectively.
Lessons Learned
- The importance of accurate and timely data integration
- The value of visual tools in simplifying complex analyses
- The necessity of continuous monitoring and updating of knowledge graphs
7. Challenges and Considerations
Data Integration and Accuracy Integrating data from multiple sources can be challenging, and ensuring its accuracy is crucial for effective threat detection.
Complexity of Graph Databases Graph databases like Neo4j require a different approach to data modeling and querying, which can be complex and require specialized knowledge.
Training and Expertise Requirements Utilizing Neo4j and knowledge graphs effectively requires training and expertise, which can be a barrier for some organizations.
8. Future Trends and Developments
Advances in Graph Technology Continuous advancements in graph technology will enhance the capabilities and performance of Neo4j and similar platforms.
Integration with AI and Machine Learning Combining graph databases with AI and machine learning will enable more sophisticated threat detection and predictive analytics.
Emerging Use Cases As graph technology evolves, new use cases will emerge, further enhancing the ability to detect and visualize threats in various domains.
9. Why Knowledge Graphs and Threat Detection?
Neo4j and knowledge graphs offer a powerful approach to visualizing and understanding detected threats. By leveraging the capabilities of graph databases, organizations can enhance their threat detection processes, improve their understanding of complex relationships, and make more informed decisions. As technology continues to advance, the integration of Neo4j and knowledge graphs with other analytical tools will become increasingly important in the ongoing battle against cyber threats.
What are examples of viewing data collected by Volatility plugins and displayed as a graph?
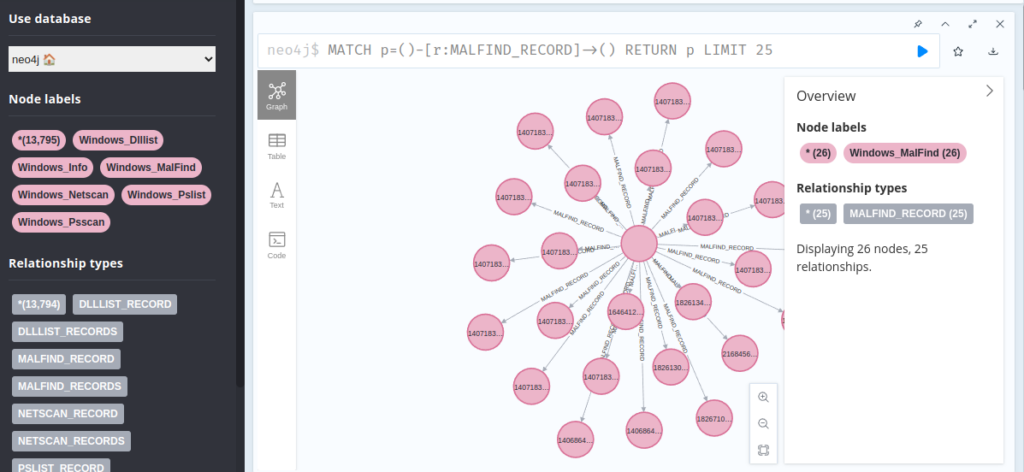
Data collected from the Volatility “Malfind plugin”.
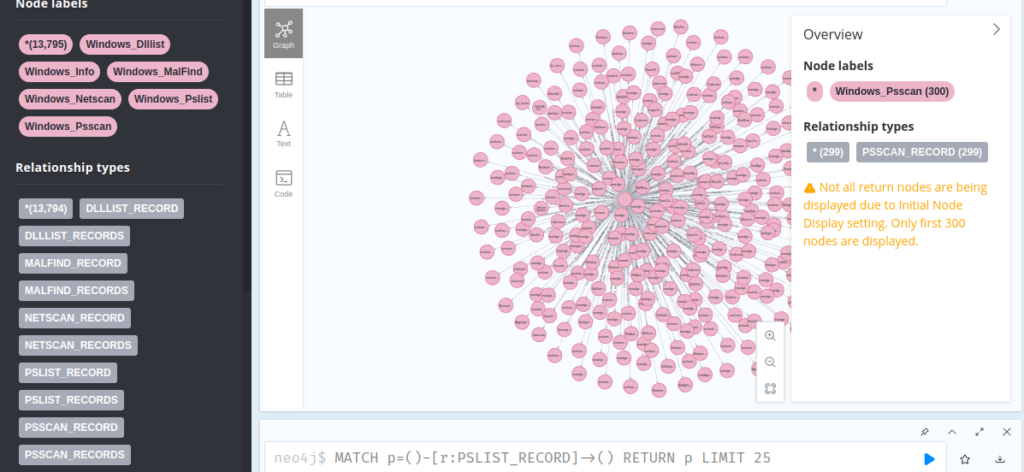
Data collected from the Volatility “PSScan” plugin — hint on the enormity of the data to be analyzed.
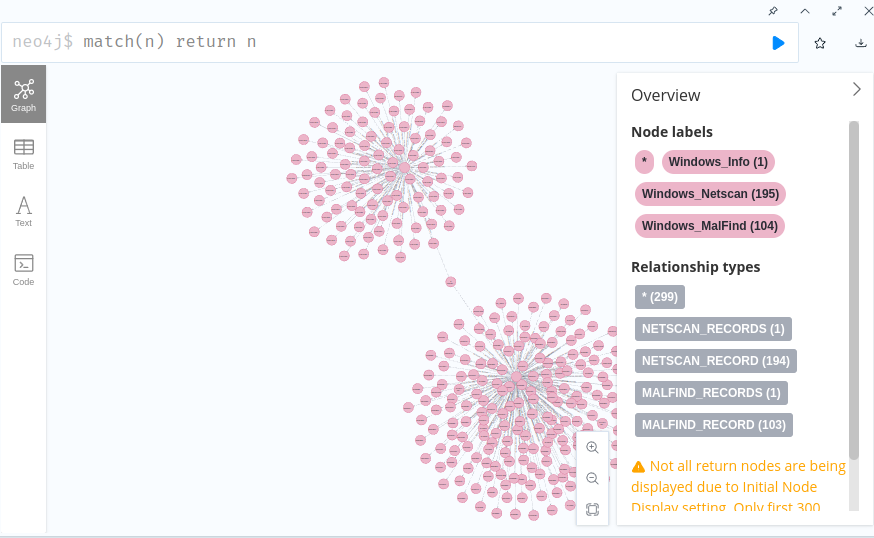
Data collected and relationship of the Volatility plugins “Netscan”, “Malfind” and “Info”
603-505-6500
osint@overvotch.com
Discover more from Threat Detection
Subscribe to get the latest posts sent to your email.